
When you are scalping on the 5 minute chart for example, you will get both buy and sell signals. Much of the time they will both be actionable signals. Occasionally however, you will find that those trades move against you because they are being influenced by higher time frame movements.
To avoid taking bad trades in our scalping, we can use the multi time frame feature to confirm the trend direction across multiple time periods.
To ensure that you are not taking bad trades, eliminate scalping signals that do not coincide with the higher time frames.
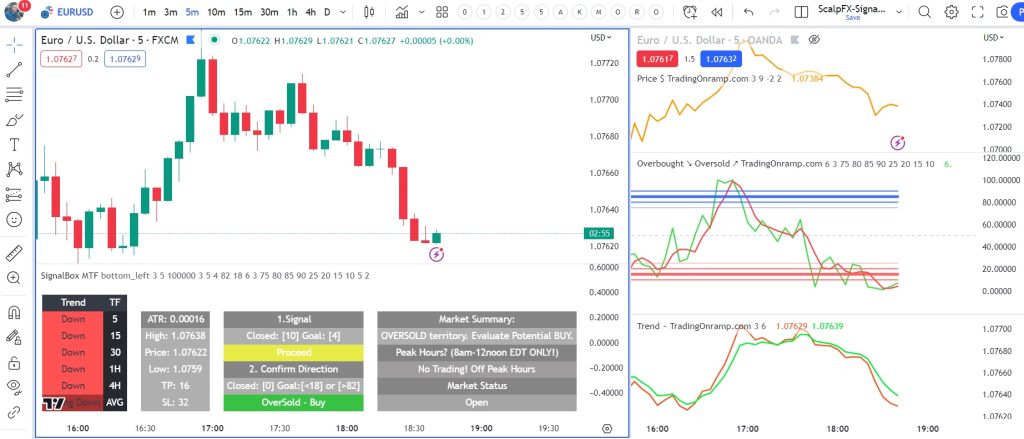
In the photo above, you can see that we received an oversold buy signal that may be a valid signal but is contrary to the larger trend direction. This is often referred to as “catching a falling knife”. This type of trade has a higher likelihood of failing, or not moving strongly enough to be profitable.
In a strong downtrend such as the one pictured, you may choose to only take short positions, selling in a downtrend.
How did this specific trade turn out?
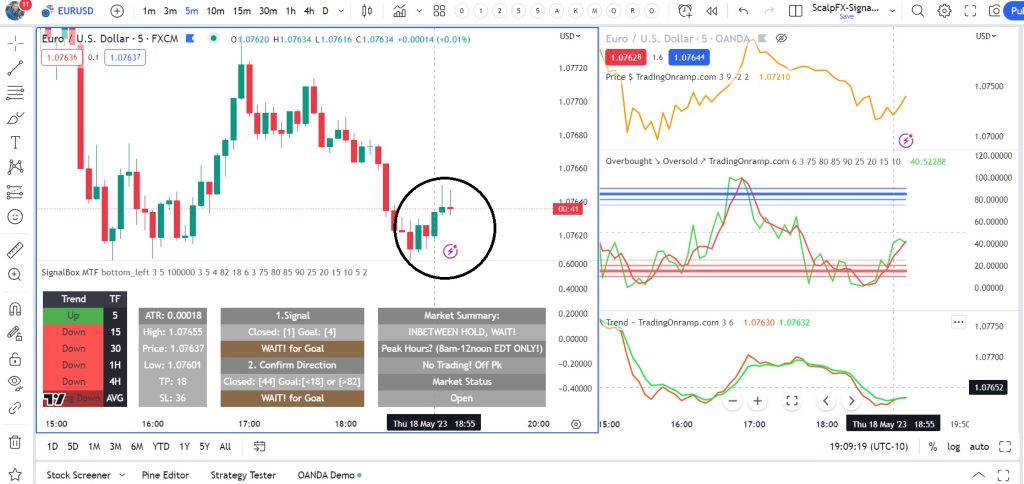
Even though we were in a heavy down trend across multiple time frames, the buy signal appears to have been valid and profitable with proper risk management.
If you do decide to enter counter trend trades, at least you can do so with a better understanding of the context in the higher time frames and make an informed decision based on your trading plan.
How did this trade end up over time?
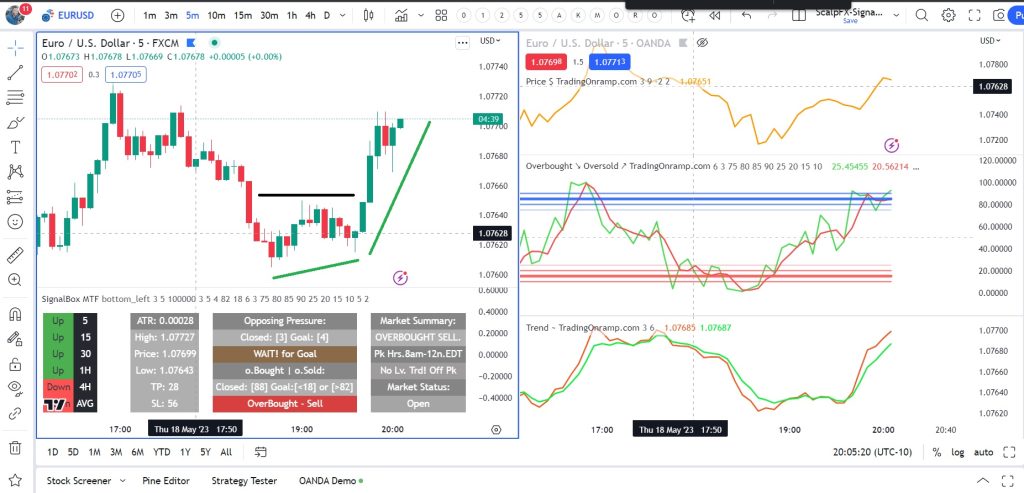
As you can see above, even though we were in a heavy downtrend, and all the multi time frame indicators showed a downtrend, the buy signal still led us to a large move, albeit after a longer than normal period of time and with significant downward pressure and resistance in the beginning of the trade.
It’s interesting to note that there were no other confirmed buy signals during this time, so I am impressed that this buy signal played out and held up even in the middle of such a large down trend.
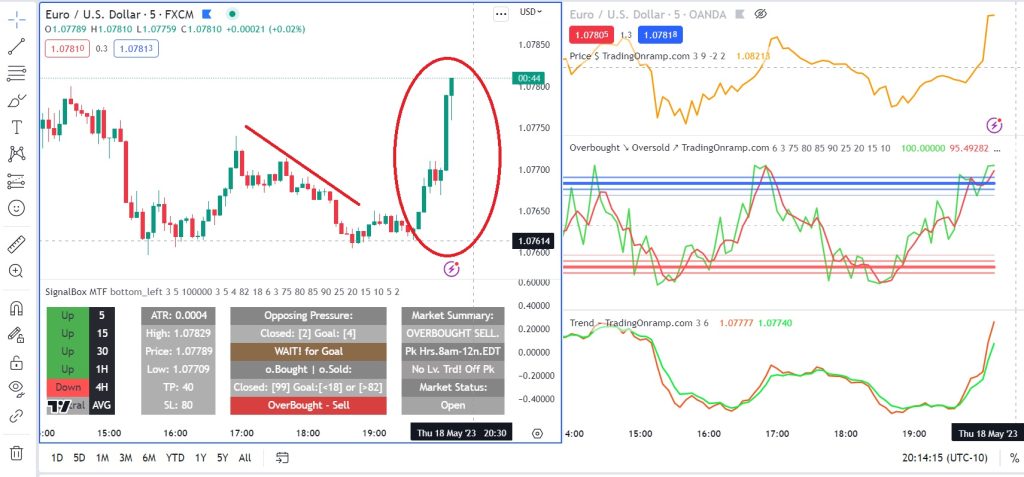
Ultimately, this turned into a rather large move, and a strong reversal across the lower time frames.
This may be a poor example of a “bad trade to avoid” as it ended up being a valid, profitable buy signal.
I am quite impressed with our indicators for pointing this one out.
That’s the conclusion of this analysis. Always do your own interpretations and analysis before making a trade.
For more general guidance about multi time frame analysis, please read the following:
Trading with the trend using multi-time frame analysis is a strategy that traders use to align their trades with the prevailing direction of the market. It involves analyzing price movements across different time frames to identify the overall trend and then making trading decisions that are in harmony with that trend.
Multi-time frame analysis involves examining charts of various time frames, such as daily, hourly, and 15-minute charts, to gain a comprehensive view of the market. Each time frame provides different insights into the trend, allowing traders to assess the overall market sentiment and make more informed trading decisions.
Here’s a brief explanation of how to trade with the trend using multi-time frame analysis:
- Identify the primary trend: Start by analyzing the higher time frames, such as the daily or weekly charts, to determine the primary trend. Look for patterns, such as higher highs and higher lows in an uptrend or lower highs and lower lows in a downtrend.
- Confirm the trend: Once the primary trend is identified, move to lower time frames, such as the hourly or 15-minute charts, to confirm the trend. Look for consistent price patterns that align with the primary trend.
- Entry and exit points: When the trend is confirmed across multiple time frames, look for suitable entry and exit points. Traders often wait for pullbacks or retracements within the trend to enter trades at better prices. Additionally, they may use indicators or chart patterns to identify potential reversal or continuation signals that align with the trend.
- Risk management: Implement proper risk management techniques, such as setting stop-loss orders to limit potential losses and trailing stops to protect profits as the trade progresses. Adjust the position size based on the risk-reward ratio to maintain a balanced approach.
- Monitor the trend: Continuously monitor the price action and the trend across multiple time frames to ensure it remains intact. Adjust your trading strategy or exit the trade if there are signs of a trend reversal or change in market conditions.
Trading with the trend using multi-time frame analysis allows traders to align their trades with the overall market direction, increasing the probability of success. It helps traders avoid counter-trend trades and provides a more comprehensive view of market dynamics. However, it is essential to combine this analysis with other technical and fundamental tools to make well-informed trading decisions.
