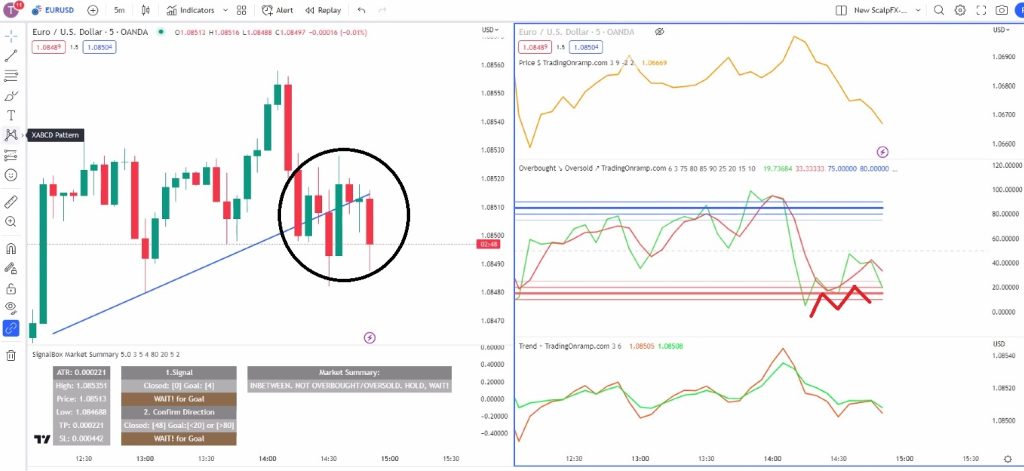
In this specific scenario, we encounter an oversold condition indicated by the overbought/oversold (OB/OS) indicator. This suggests a potential buy opportunity in the market. However, upon analyzing the price and trend lines, we notice that they are facing downward, indicating a bearish trend. In this situation, we exercise caution and avoid a potential fake-out by refraining from entering a trade immediately.
Instead, we adopt a patient approach and wait for the price to continue its downward movement, confirming the bearish trend. By withholding our entry, we aim to avoid entering a trade prematurely and potentially suffering losses if the market reverses. Our decision to wait is based on the understanding that an oversold condition alone may not be sufficient to guarantee a reversal, especially when the price and trend lines are still indicating downward momentum.
By exercising patience and waiting for the confirmation of a continued downward movement, we enhance our trading strategy. This approach enables us to make more informed decisions, ensuring that we enter the market when the trend aligns with the oversold condition, thereby maximizing our chances of success.
On the candle bar chart, an event occurred that further validated our decision to avoid the earlier potential buy opportunity. A corollary breakdown below the support level took place, mirroring the earlier identified fake-out pattern. This breakdown confirmed the bearish sentiment in the market and indicated a further downward movement.
The breakdown below the support level signifies that the selling pressure has intensified, outweighing the buying pressure and causing a breach of the established support level. This breakdown serves as an important confirmation of the bearish trend, affirming that the market sentiment is indeed heading down.
By recognizing this correlary breakdown below support, we gain additional confirmation that our decision to wait for the continuation of the downward movement was prudent. This breakdown strengthens our conviction in the bearish direction and reinforces the importance of patience and thorough analysis in avoiding potential fakeouts and entering trades with higher probabilities of success.

Following the initial fakeout, an intriguing series of events unfolded on the price chart. After the price fell below the support level, it managed to regain support temporarily, creating a deceptive upward movement that faked out traders. However, this bullish resurgence proved short-lived as the price eventually broke below the support level once again, confirming the original bearish sentiment. These subsequent price actions validate our decision to avoid the trade based on the initial reading.
The fact that the price failed to sustain its upward momentum and fell back below the support level suggests a lack of genuine buying interest and potential weakness in the market. This price behavior reinforces the notion that the initial signal was unreliable and emphasizes the significance of exercising caution. By avoiding the trade initially, we prevented ourselves from being caught in a false rally and potential losses, showcasing the importance of prudent decision-making and staying adaptable to changing market dynamics.
These price movements serve as a valuable reminder that relying solely on initial readings may not always provide an accurate assessment of market conditions. It underscores the need for comprehensive analysis and a patient approach to trading, allowing us to avoid false signals and make more informed decisions.

