
Tips & Tricks on how to “Fix Your Charts” on TradingView layouts.
Whether you are using a 1, 2 or 3 chart layout on TradingView, there are some common features of layouts & charts that you can master to make it easier to navigate your charts, or to recover your charts when they are “gone” or “invisible”.
Layouts are all the charts combined into one layout. You can have multiple charts in one layout, but not more than one layout at one time.
Charts are individual charts that can have different settings, time frames and properties.
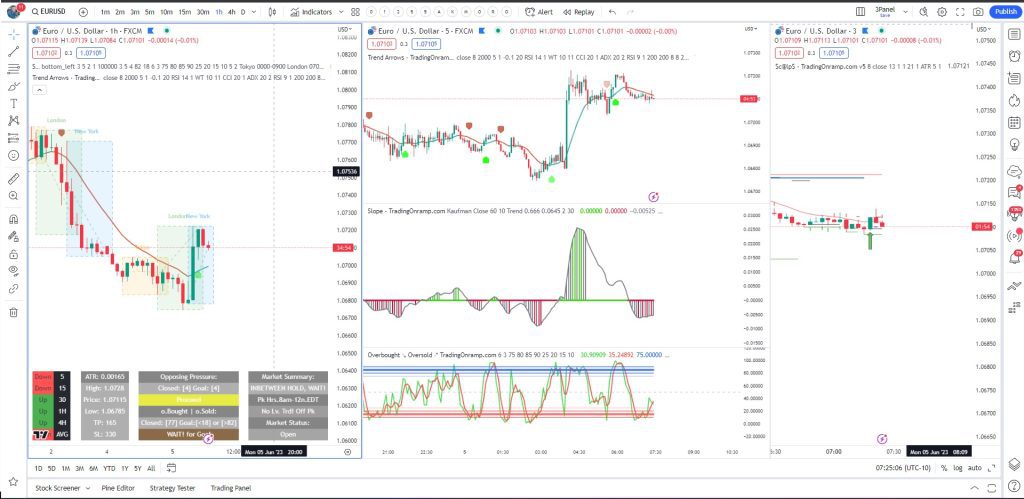
This is 1 Layout with 3 charts:
If you can’t see your charts on TradingView for whatever reason, the first and most common solution is to simply Refresh Your Browser either using the URL bar, or the refresh button on your browser.
If refreshing the page doesn’t work, you can also refresh the chart itself, or even refresh your layout.
Refresh Charts
You can refresh any chart but hovering your cursor over the bottom area of the chart until the chart control appear. They auto-hide / auto-show by hovering the mouse over the bottom of an individual chart.
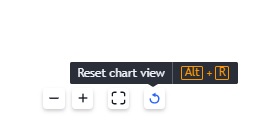
If the refresh chart icon is not visible, you may need to engage your chart by click anywhere on the chart, dragging it slightly so that it is in a new position, and then the refresh chart icon will appear.
You can also use the keyboard shortcut “Alt + R” to refresh your active chart.
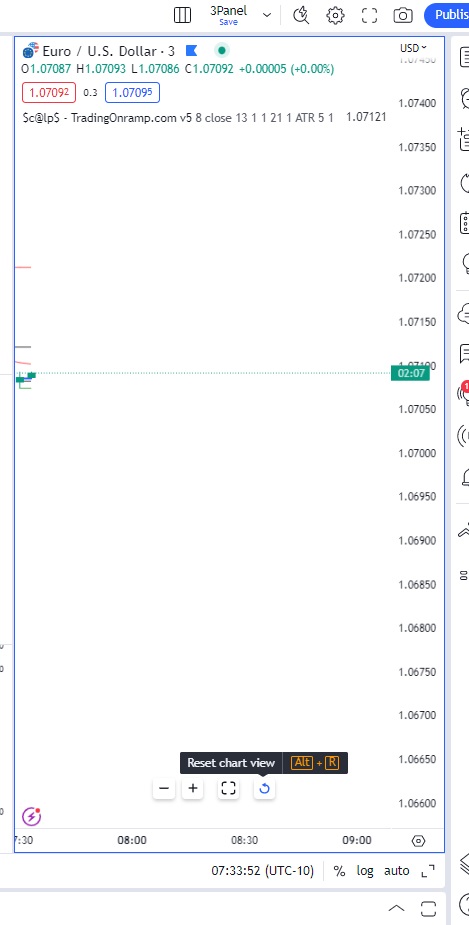
Activate / Select Chart
Each chart in a layout is it’s own entity with its own settings and can be acted on independantly of other charts in the layout.
To Select or activate a specific chart in a layout, click on the chart area and you will notice that it is highlighted with a blue outline as in the image below.
Layout Tips
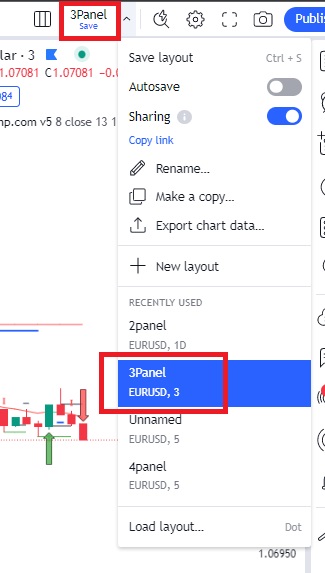
You can reload a saved layout, but Do NOT Save A Layout you have only slightly modified because you will likely over write the original layout. When it comes to Layouts, try to avoid clicking on the blue save text, and only use the arrow to bring up the load saved Layouts dropdown and start over with an existing Layout.
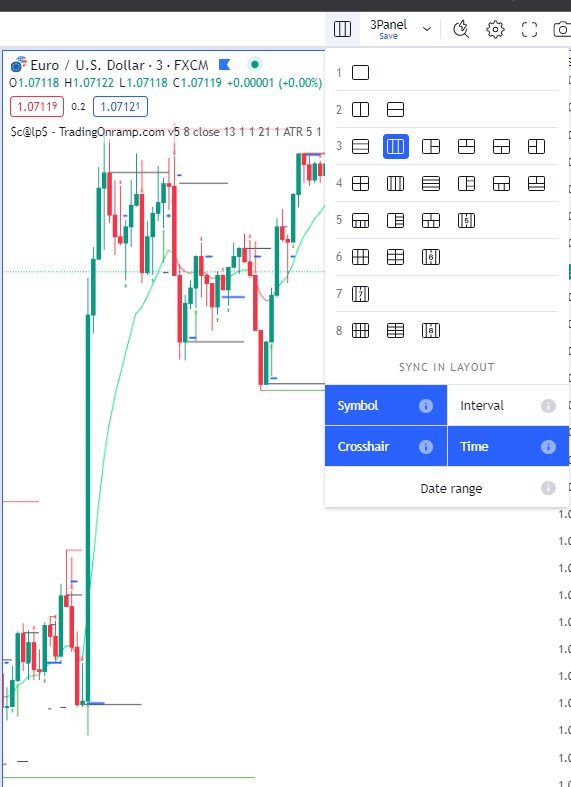
Synchronize Charts
You can synchronize or desynchronize certain chart settings using the chart panel icon on the left of the layout dropdown. This will allow you to synchronize the symbol, time frame, date range, time and crosshair attributes of the charts.
Show / Hide Extra Panels
You can show or hide extra panels to free up more screen space such as the watchlist panel, alerts panel or trading panel by clicking on the icon on the right side menu bar, or by minimizing the footer panel area as shown in the picture below.

Resize A Chart
To resize or scale a chart to make it larger or smaller, or to see more details, you can click and drag on the X axis or the Y axis of a chart. Slowly click and drag in the direction you want to make it the zoom level you desire. If you go too far and want to start over, you can always refresh your chart.
Change Chart Time Frame
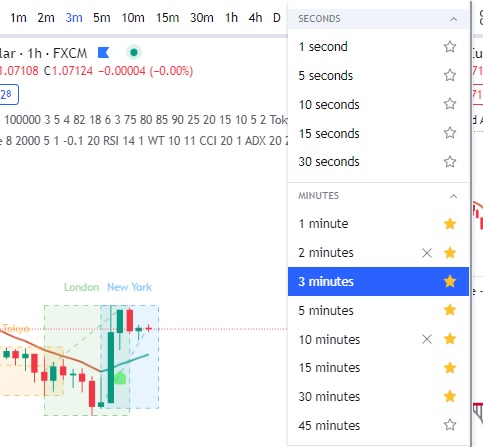
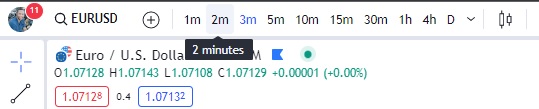
You can change your chart time frame using the time frame bar at the top of your trading interface. If you do not see any time frames, or only see “D” or “M”, you may need to add more timeframes into your favorite bar.
Master Your Charts
Having complete control over your trading interface is an integral step of being a successful trader. Practice opening, closing, zooming, moving, and understand all the settings of your charts so you are always looking at the precise data you want to see.
Happy Trading!!!

