
Mastering Market Timing with the Dynamic Slope Indicator
Timing the market is often referred to as a challenging feat, but with the right tools and strategies, investors can significantly improve their chances of making successful trades. One such tool gaining popularity is the Dynamic Slope Indicator, a unique approach that alternates between identifying market cycle tops and bottoms, bolstered by confirmation signals derived from the “window of opportunity” when the histogram is blank. In this blog post, we will delve into the intricacies of this indicator and how you can leverage it to make informed trading decisions.
Understanding the Dynamic Slope Indicator
The Dynamic Slope Indicator is a versatile tool designed to help traders and investors identify optimal entry and exit points within the market. It focuses on capturing the cyclic nature of financial markets and the recurring patterns of market tops and bottoms. Unlike traditional technical indicators that rely on fixed parameters, the Dynamic Slope Indicator adapts dynamically to changes in market conditions, making it more resilient to sudden shifts.
Utilizing Confirmation Signals
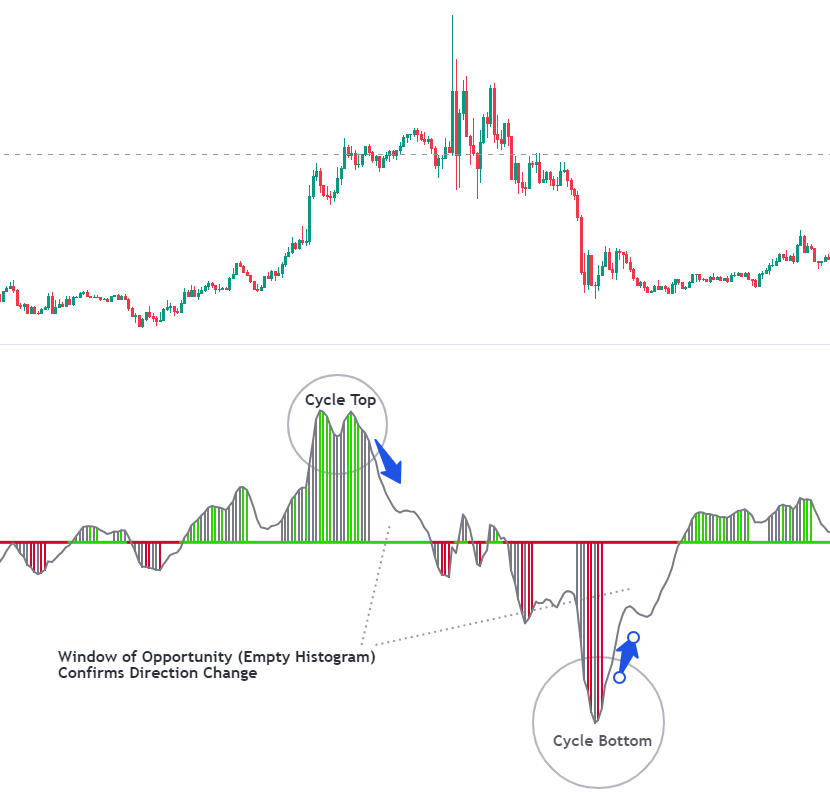
The true power of the Dynamic Slope Indicator lies in its integration of confirmation signals, which are derived from the “window of opportunity” when the histogram is blank. This window represents a momentary pause in market momentum and can be an early sign of a potential trend reversal. The confirmation signals act as a safeguard against false signals and provide traders with added confidence in their decisions.
Here’s how you can use confirmation signals to your advantage:
- Identify the Blank Histogram: Keep a close eye on the indicator’s histogram. When it turns blank, it signifies a potential shift in market sentiment. This is your cue to pay attention and start looking for additional confirmation.
- Analyze Supporting Indicators: To validate the potential trend reversal indicated by the blank histogram, use complementary technical and fundamental analysis tools. Look for corroborating signals from other indicators like moving averages, volume trends, and market news.
- Monitor Key Levels: Evaluate the current price level in relation to key support and resistance levels. A blank histogram, when combined with a bounce off a significant support or resistance level, can further strengthen the confirmation of a market cycle reversal.
- Wait for Price Action Confirmation: Price action is a powerful tool. Wait for a price pattern like a bullish or bearish engulfing candlestick to form after the blank histogram. This can provide more assurance that a trend reversal is likely.
- Consider Market Context: Take into account the broader market context, economic indicators, and geopolitical factors. Confirm that the potential reversal aligns with the prevailing market sentiment.
- Risk Management: No indicator is foolproof. Always implement sound risk management strategies, such as setting stop-loss orders, to protect your capital in case the trade doesn’t go as anticipated.
The Dynamic Slope Indicator, coupled with confirmation signals derived from the blank histogram window of opportunity, offers traders a powerful tool for navigating the complex world of financial markets. By understanding the cyclic nature of market tops and bottoms and harnessing the indicator’s adaptability, you can significantly enhance your trading decisions.
Remember that successful trading involves a blend of technical analysis, fundamental research, and a clear understanding of market psychology. While the Dynamic Slope Indicator can provide valuable insights, it should be just one component of your comprehensive trading strategy. Keep refining your skills, stay disciplined, and continually educate yourself to improve your chances of consistent success in the dynamic world of trading.
