
EURUSD 15m
EURUSD 5m
EURUSD 3m
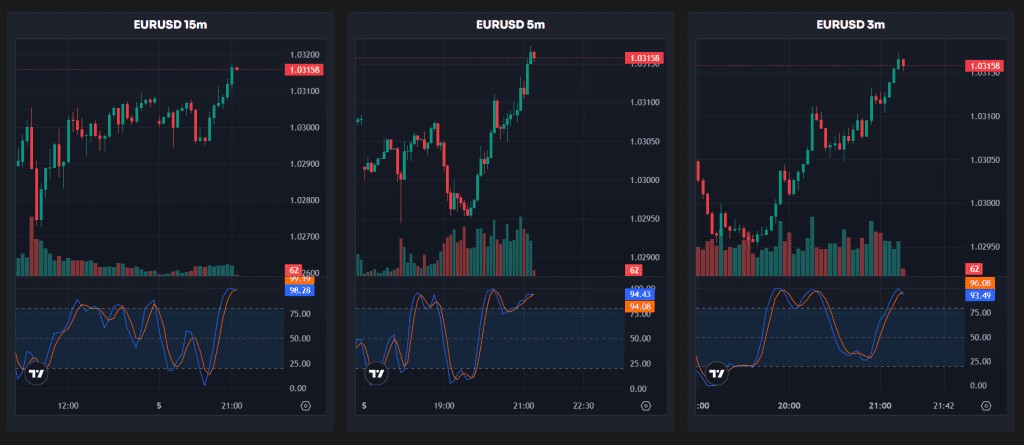
Scalping Strategy Using Multi-Timeframe EUR/USD Charts with Stochastic RSI
Scalping in the forex market requires quick decision-making and a structured approach to identify high-probability trades. Using EUR/USD charts on 15-minute (15m), 5-minute (5m), and 3-minute (3m) timeframes in conjunction with the Stochastic RSI indicator, we can enhance the accuracy of our trades through timeframe confluence, indicator alignment, and direction confirmation. Here’s how:
1. Timeframe Confluence
Multi-timeframe analysis increases confidence in trade setups:
- 15m Chart: The higher timeframe sets the broader trend and provides key support/resistance levels. Identify whether the market is trending up, down, or ranging.
- 5m Chart: Serves as an intermediate confirmation. Look for alignment with the 15m trend, such as pullbacks in a trending market or consolidations near a breakout point.
- 3m Chart: Used for pinpointing entry and exit points with precision. It provides the most detailed view of price action for scalping trades.
Example:
- If the 15m chart indicates an uptrend (higher highs and higher lows), only consider buying opportunities on the 5m and 3m charts to align with the trend.
2. Indicator Confluence
The Stochastic RSI is used to measure momentum and overbought/oversold conditions. Confluence between the three charts strengthens the reliability of signals:
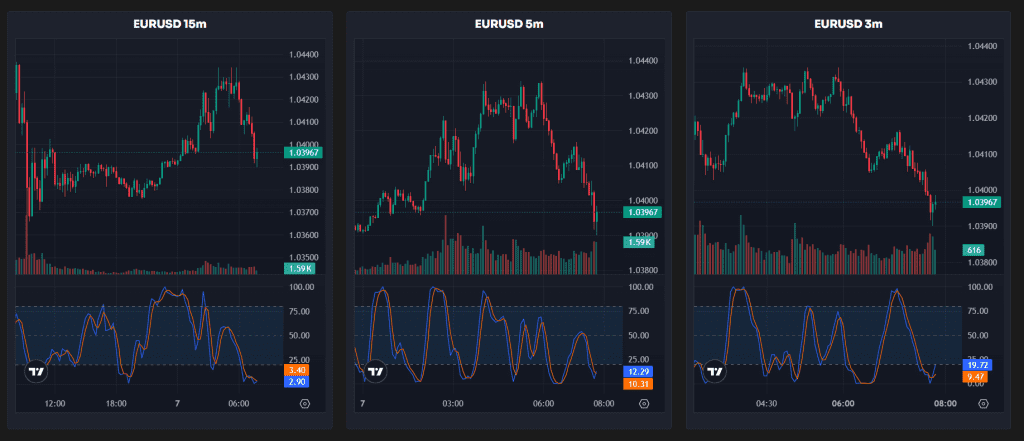
- Overbought Condition: Stochastic RSI values are above 80, signaling potential selling pressure.
- Oversold Condition: Stochastic RSI values are below 20, signaling potential buying pressure.
- Look for agreement across the timeframes:
- Bullish Signal: All charts show Stochastic RSI rising from the oversold zone (below 20).
- Bearish Signal: All charts show Stochastic RSI falling from the overbought zone (above 80).
Example:
- On the 15m chart, Stochastic RSI crosses above 20 (oversold recovery), and on the 5m and 3m charts, the indicator aligns with this upward momentum.
3. Direction Confirmation
Combine price action and the Stochastic RSI to confirm trade direction:
- Trend Continuation:
- In a clear trend, wait for pullbacks to oversold (buy in an uptrend) or overbought (sell in a downtrend) zones on the 5m and 3m charts.
- Use the 15m chart to ensure the trade aligns with the primary trend.
- Reversal Trades:
- For counter-trend trades, ensure strong confluence between timeframes, such as Stochastic RSI divergence (price makes a new high/low, but Stochastic RSI does not).
Entry and Exit Strategy
- Entry:
- Wait for Stochastic RSI to confirm momentum in the desired direction on all three timeframes.
- Use the 3m chart to fine-tune entry near key levels (e.g., support in an uptrend or resistance in a downtrend).
- Stop-Loss:
- Place stop-loss just beyond the most recent swing high/low on the 3m chart.
- Exit:
- Target a nearby resistance/support level or exit when Stochastic RSI on the 3m chart reaches the opposite extreme (e.g., overbought in a buy trade).
Example Setup
- 15m Chart:
- Trend: Uptrend with a pullback approaching a key support level.
- Stochastic RSI: Rising from oversold (<20).
- 5m Chart:
- Price: Pullback is stabilizing near the 15m support level.
- Stochastic RSI: Shows oversold recovery and aligns with 15m.
- 3m Chart:
- Price: Forms a bullish candlestick pattern (e.g., hammer or engulfing).
- Stochastic RSI: Shows an upward cross and starts rising.
Entry: Go long at the 3m chart confirmation. Exit: At a predetermined resistance or when the 3m Stochastic RSI signals overbought.
This scalping strategy focuses on aligning momentum, trend, and price action across the 15m, 5m, and 3m charts to maximize trade accuracy.